
Earnings & Financial Highlights
Click here for J-MAX’s key financial data.
Status of Profitability and Assets (Consolidated)
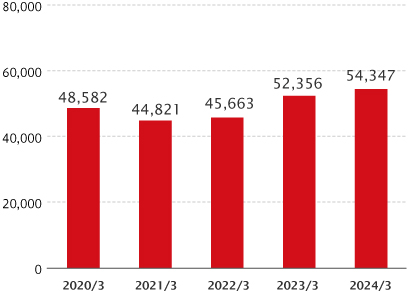
Net sales (Millions of yen)
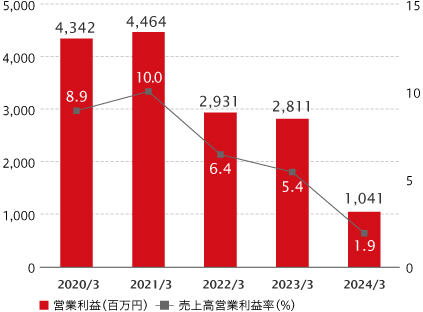
Operating profit (Millions of yen)
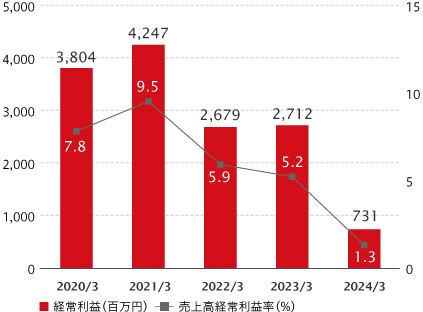
Ordinary profit (Millions of yen)
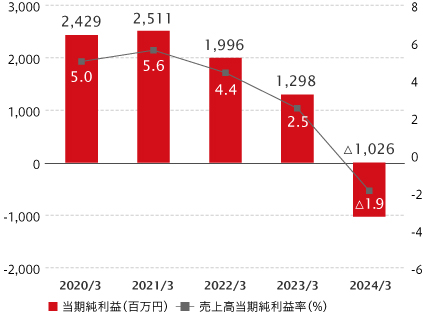
Profit (Millions of yen)
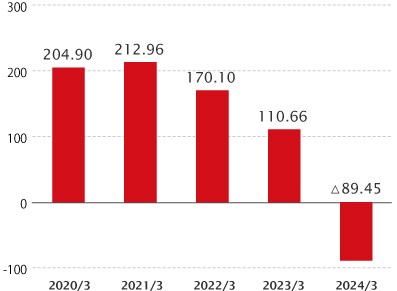
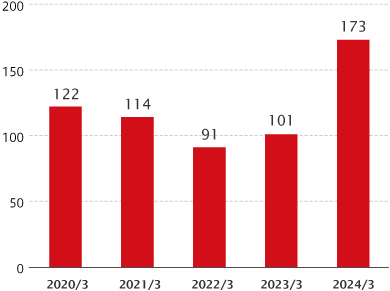
Profit per share (Yen)
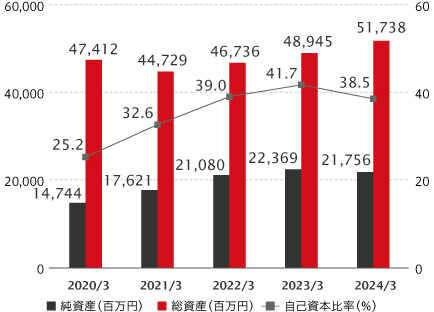
Net assets and total assets (Millions of yen)
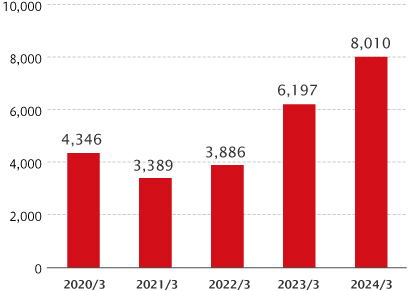
Capital expenditures (Millions of yen)
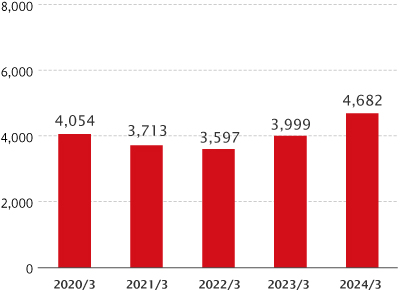
Depreciation (Millions of yen)
R&D expenses (Millions of yen)
Key Financial Indicators(Consolidated)
| 2022/3 | 2023/3 | 2024/3 | 2025/3 | 2026/3 | |
| Return on equity (%) | 12.2 | 6.7 | △5.1 | △17.4 | 4.8 |
| Return on assets (%) | 6.3 | 5.7 | 2.0 | 0.0 | 3.0 |
| Price earnings ratio (Times) | 3.8 | 6.4 | ― | ― | 5.1 |
| Cash flows from operating activities (Millions of yen) | 2,979 | 4,911 | 3,895 | 1,257 | 5,275 |
| Cash flows from investing activities (Millions of yen) | △3,934 | △5,220 | △5,958 | △6,457 | △2,928 |
| Cash flows from financing activities (Millions of yen) | △2,922 | △174 | 1,951 | 5,386 | △1,941 |
| Cash and cash equivalents at end of the period (Millions of yen) |
6,091 | 5,871 | 5,991 | 6,565 | 7,322 |